Managing PROCESS iMPROVEMENT
Over the last two decades, industrial organizations have embraced a wide variety of management programs that they hope will enhance competitiveness. Currently, two of the most popular programs are Six Sigma and lean management. Six-Sigma was founded by Motorola Corporation and subsequently adopted by many US companies, including GE and Allied Signal. Lean management originated at Toyota in Japan and has been implemented by many major US firms, including Danaher Corporation and Harley-Davidson. Six Sigma and lean management have diverse roots. The key issue driving the development of Six Sigma was the need for quality improvement when manufacturing complex products having a large number of components, which often resulted in a correspondingly high probability of defective final products. The driving force behind the development of lean management was the elimination of waste, especially in Japan, a country with few natural resources.
Both Six Sigma and lean management have evolved into comprehensive management systems. In each case, their effective implementation involves cultural changes in organizations, new approaches to production and to servicing customers and a high degree of training and education of employees, from upper management to the shop floor. As such, both systems have come to encompass common features, such as an emphasis on customer satisfaction, high quality, and comprehensive employee training and empowerment
Both Six Sigma and lean management have evolved into comprehensive management systems. In each case, their effective implementation involves cultural changes in organizations, new approaches to production and to servicing customers and a high degree of training and education of employees, from upper management to the shop floor. As such, both systems have come to encompass common features, such as an emphasis on customer satisfaction, high quality, and comprehensive employee training and empowerment
Part 1 = Lean Management :
|
Principles of Lean :
The five- step though process for lean management is simple:
|

|
An Overview Of Lean management
The concept of lean management can be traced to the Toyota production system (TPS), a manufacturing philosophy pioneered by the Japanese engineers Taiichi Ohno and Shigeo Shingo (Inman, 1999). It is well known, however, that Henry Ford achieved high throughput and low inventories, and practiced short-cycle manufacturing as early as the late 1910s. Ohno greatly admired and studied Ford because of his accomplishments and the overall reduction of waste at early Ford assembly plants (Hopp and Spearman, 2001). The TPS is also credited with being the birthplace of just-in-time (JIT) production methods, a key element of lean production, and for this reason the TPS remains a model of excellence for advocates of lean management.
By contrast, the traditional US production system was based on the “batch-and-queue” concept. High production volumes, large batch sizes, and long non-value added queue times between operations characterize batch-and-queue production. Batch-and-queue techniques developed from economy of scale principles, which implicitly assumed that setup and changeover penalties make small batch sizes uneconomical. These methods typically result in lower quality since defects are usually not discovered until subsequent operations or in the finished product.
Lean management emphasizes small batch sizes and, ultimately, single-piece flow. The term pull is used to imply that nothing is made until it is needed by the downstream customer, and the application of a make-to-order (MTO) approach whenever possible. In some industries, such as the personal computer business, MTO production has become the de facto business model. The Dell “direct sales model”, for example, quickly converts customer orders into finished personal computers ready for shipment (Sheridan, 1999). The initial “pull” on the Dell production line is the telephone or electronic order from the customer. The direct sales model also allows Dell to customize each unit to the customer’s specifications.

Another element of lean management is the reduction of variability at every opportunity, including demand variability, manufacturing variability, and supplier variability. Manufacturing variability includes not only variation of product quality characteristics (e.g. length, width, weight), but also variation present in task times (e.g. downtime, absenteeism, operator skill levels). Lean management attempts to reduce task time variation by establishing standardized work procedures. Supplier variability includes uncertainties in quality and delivery times. The reduction in supplier variability is often achieved through partnerships and other forms of supplier-producer cooperation.
It should be mentioned that individual processes do exist for which batch-and-queue systems are still currently necessary. This is often the case when performing operations such as chrome plating, where large batches are placed in plating tanks. In wrench manufacturing, for example, steel forgings might move in a single-piece flow through a U-shaped machining cell, but then accumulate into a large batch at the end of the cell before being moved to a chrome plating station. In fact, very few lean manufacturers have pure single-piece-flow systems throughout their entire operation.
Lean management also applies to indirect and overhead activities. Any policy or procedure having a goal of optimizing the performance of a single portion of a company risks violating lean management rules. For example, a purchasing manager who is given a reward for cutting costs of component parts may sacrifice quality to achieve his or her goal. Accounting systems that measure efficiency of output for individuals or departments may encourage the generation of products when no demand exists.
Quality management practices in lean production emphasize the concept of zero quality control (ZQC). A ZQC system includes mistake proofing (poka-yoke), source inspection (operators checking their own work), automated 100 percent inspection, stopping operations instantly when a mistake is made, and ensuring setup quality (Shingo, 1986). Typically, inspections are performed quickly using go-no go gages rather than more time consuming variable measurement methods.
Part 2 = Six Sigma
|
The principles :
The thought process for six-sigma is also a simple five-step procedure: 1. Define: Define project scope, select output characteristics (Y axis). 2. Measure: Assess performance specifications, Validate measurement systems, establish initial capability (for Y’s). 3. Analyze: Define performance objectives, document potential X’s, Analyze sources of variability. 4. Improve: Screen potential causes, identify operating conditions. Control: Determine process capability (for X’s), Implement process controls, Document what you have learned |

|
An overview of six sigma
|
Put simply, Six Sigma is a management philosophy developed by Motorola that emphasizes setting extremely high objectives, collecting data, and analyzing results to a fine degree as a way to reduce defects in products and services. The Greek letter sigma is sometimes used to denote variation from a standard
The roots of Six Sigma can be traced to two primary sources: total quality management (TQM) and the Six-Sigma statistical metric originating at Motorola Corporation. Today, Six Sigma is a broad long-term decision-making business strategy rather than a narrowly focused quality management program. |

|
From TQM, Six Sigma preserved the concept that everyone in an organization is responsible for the quality of goods and services produced by the organization. Other components of Six Sigma that can be traced to TQM include the focus on customer satisfaction when making management decisions, and a significant investment in
education and training in statistics, root cause analysis, and other problem solving
methodologies. With TQM, quality was the first priority. The main tools of TQM
included the seven tools of quality: control charts, histograms, check sheets, scatter
plots, cause-and-effect diagrams, flowcharts, and Pareto charts; and the seven
management tools of quality: affinity diagrams, interrelationship digraphs, tree
diagrams, matrix diagrams, prioritization matrices, process decision program charts, 7 and activity network diagrams (Sower et al., 1999).
The six-sigma metric was developed at Motorola in 1987 in response to sub-standard product quality traced in many cases to decisions made by engineers when designing component parts. Traditionally, design engineers used the “three-sigma” rule when evaluating whether or not an acceptable proportion of manufactured components would be expected to meet tolerances. When a component’s tolerances were consistent with a spread of six standard deviation units of process variation, about 99.7 percent of the components for a centered process would be expected to conform to tolerances. That is, only 0.3 percent of parts would be nonconforming to tolerances, which translates to about 3,000 non-conforming parts per million (NCPPM).
The six-sigma metric was developed at Motorola in 1987 in response to sub-standard product quality traced in many cases to decisions made by engineers when designing component parts. Traditionally, design engineers used the “three-sigma” rule when evaluating whether or not an acceptable proportion of manufactured components would be expected to meet tolerances. When a component’s tolerances were consistent with a spread of six standard deviation units of process variation, about 99.7 percent of the components for a centered process would be expected to conform to tolerances. That is, only 0.3 percent of parts would be nonconforming to tolerances, which translates to about 3,000 non-conforming parts per million (NCPPM).

At Motorola, as products became more complex, defective products were becoming more commonplace while at the same time customers were demanding higher quality. For example, a pager or cell phone included hundreds of components. Each component typically included numerous important quality characteristics. It was not uncommon for a product to include thousands of opportunities for defects (OFDs) in each product sold (Harry and Schroeder, 2000). Traditional three-sigma quality for each OFD was no longer acceptable. For example, consider a product that contains 1,000 OFDs. If, for each OFD, three-sigma quality levels are achieved, only about 5 percent of the products would be defect free. The calculation used to obtain this probability requires raising the fraction conforming (0.997) to the power of 1,000, and is based on the binomial probability distribution (Devore, 2000).
The formula used to determine the probability of defect-free products provides only an approximate guideline for two reasons. Since three-sigma is the minimum design standard, it would be expected that many products would surpass the three-sigma standard. On the other hand, the 0.997 conformance probability assumes a centered process and it would be expected that many processes would not be centered every time a component is produced. The calculation does, however, effectively illustrate the challenge inherent in producing defect-free products. Assuming 1,000 OFDs, only 37 percent of products will be free of defects if the quality level at each OFD averaged 99.9 percent, and 90 percent of products will be free of defects if the quality level at each OFD averaged 99.99 percent.
Other industries face similar challenges in achieving superior quality. In addition to the consumer electronics industry, other products with a large number of OFDs include automobiles, engines, airframes, and computers. Many industries where products are less complex also face similar challenges. Manufacturers of medical devices and other products where defects in the field may cause harm must achieve almost perfect quality. Companies that manufacture less complex products but sell them in very large volumes also need to be focused on achieving superior quality.

|

|
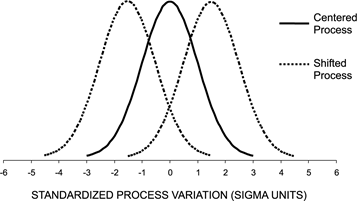
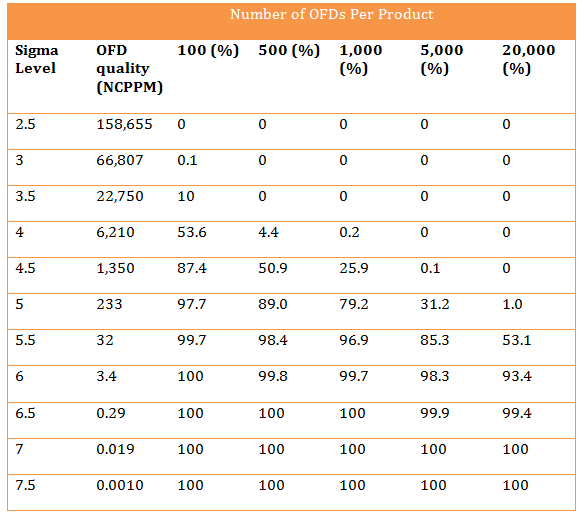
At Motorola, when studying the relationship between component quality and final product quality it was discovered that, from lot-to-lot, a process tended to shift a maximum of 1.5 sigma units (McFadden, 1993). This concept is shown graphically in Figure 2, which shows a centered process and processes shifted 1.5 sigma units in both directions. Table I provides the relationship between component quality and final product quality, assuming that the full 1.5 sigma shift takes place. In Table I, Sigma level is the standardized process variation (see Figure 2), OFD quality is the NCPPM if the process shifts a full 1.5 sigma units, and the probabilities in the table provide the proportion of final products that will be free of defects. For example, if the company sets a goal for final product quality of 99.7 percent and products include about 1,000 OFDs, then the 3.4 NCPPM corresponding to the Six-Sigma metric would became the standard against which all decisions were made.
Figure 2
In late 1999, Ford Motor Company became the first major automaker to adopt a Six Sigma strategy. At Ford, each car has approximately 20,000 OFDs. Therefore, if Ford were to attain Six Sigma quality, approximately one car in every 15 produced would contain a defect (Truby, 2000). It is interesting to note in Table I that if Ford operated at a 5.5 sigma level, about 50 percent of their cars would include at least one defect.
Table 1
Today, Six Sigma is a combination of the Six-Sigma statistical metric and TQM, with additional innovations that enhance the program’s effectiveness while expanding its focus. The main components of Six Sigma retained from TQM include a focus on the customer, recognition that quality is the responsibility of all employees, and the emphasis on employee training. The Six-Sigma metric is also used, but in an expanded fashion.
With Six Sigma, the value of an organization’s output includes not just quality, but availability, reliability, delivery performance, and after-market service. Performance within each of the components of the customer’s value equation should be superior. Hence, the Six-Sigma metric is applied in a broad fashion, striving for near perfect performance at the lowest level of activity. In addition, Six Sigma programs generally create a structure under which training of employees is formalized and supported to ensure its effectiveness. All employees involved in activities that impact customer satisfaction would be trained in basic problem solving skills. Other employees are provided advanced training and required to act as mentors to others in support of quality improvement projects
With Six Sigma, the value of an organization’s output includes not just quality, but availability, reliability, delivery performance, and after-market service. Performance within each of the components of the customer’s value equation should be superior. Hence, the Six-Sigma metric is applied in a broad fashion, striving for near perfect performance at the lowest level of activity. In addition, Six Sigma programs generally create a structure under which training of employees is formalized and supported to ensure its effectiveness. All employees involved in activities that impact customer satisfaction would be trained in basic problem solving skills. Other employees are provided advanced training and required to act as mentors to others in support of quality improvement projects
^Excerpt from Arnheiter & Maleyeff (2005)
now test yourself
Case Studies to expand knowledge
|
| ||||
Bibliography
Arnheiter, E.D., Maleyeff, J., (2005), The Intergeration of Lean Management and Six Sigma, Lally School of Management & Technology, Rensselaer Polytechnic Institute, Hartford, pp 6-15
Devore, J.L. (2000), Probability and Statistics for Engineering and the Sciences, 5th ed., Duxbury Press, Pacific Grove, CA, pp. 119-26.
Hopp, W.J. and Spearman, M.L. (2001), Factory Physics, 2nd ed., Irwin/McGraw-Hill, New York, NY, p. 25.
Inman, R.R. (1999), “Are you implementing a pull system by putting the cart before the horse?”, Production and Inventory Management Journal, Vol. 40 No. 2, pp. 67-71
McFadden, F.R. (1993), “Six-Sigma quality programs”, Quality Progress, Vol. 26 No. 6, pp. 37-42.
Sheridan, J.H. (2000), “Lean Sigma synergy”, Industry Week, Vol. 249 No. 17, pp. 81-2.
Shingo, S. (1986), Zero Quality Control – Source Inspection and the Poka-yoke System, Productivity Press, Cambridge, MA.
Sower, V.E., Savoie, M.J. and Renick, S. (1999), An Introduction to Quality Management and Engineering, Prentice-Hall, Upper Saddle River, NJ, pp. 33-45.
Womack, J.P. and Jones, D.T. (1996), Lean Thinking, Simon & Schuster, New York, NY, pp. 90-8.